
How to get started with querying on Dune Analytics
This post goes over some basic examples of how to search and write basic queries as well as visualize them with graphs on Dune Analytics.
This post goes over some basic examples of how to search and write basic queries as well as visualize them with graphs on Dune Analytics. No prior knowledge needed and the opportunities for exploration are limitless.
This is a guest post by Alex Manuskin. It was first published on Medium and has been slightly updated before publishing here.
If you prefer a video tutorial you can check out this video.
Dune Analytics is a powerful tool for blockchain research. It can be used to query, extract, and visualize vast amounts of data on the Ethereum blockchain.

Dex Volume percentage (source)
In public blockchains such as Ethereum, all the information is inherently public. All you need is to look for it. So far, answering questions such as how many users does a project has, or what is the daily volume of a DEX, would most likely require writing a specialised script. Running the script would involve iterating over blocks, parsing the information, properly sorting it, and extracting the data.
This can be both time-consuming as well as extremely specialised. Scripts like that would likely be able to extract information about one specific project but would require extensive modifications to generalise for anything else. Besides, running on all blocks is a long process in itself, that requires either a full node or many individual queries to an external service.
Dune Analytics to the rescue
Dune Analytics is a tool that greatly simplifies the process. It is a web-based platform for querying Ethereum data by using simple SQL queries, from pre-populated databases. Instead of writing a specialized script, one can simply query the database to extract almost any information that resides on the blockchain. This guide covers the basics of how to search, write, and visualize basic queries on Dune, so you can go from zero to blockchain analyst in no time. Even if you have never used SQL before, only a few basic examples can go a long way.
How Dune Analytics works
At its core, Dune analytics aggregates the raw data from the blockchain into SQL databases that can be easily queried. For example, there is a table to query all Ethereum transaction, nicely separated into columns. Columns cover the sender, the receiver, the amount, etc.
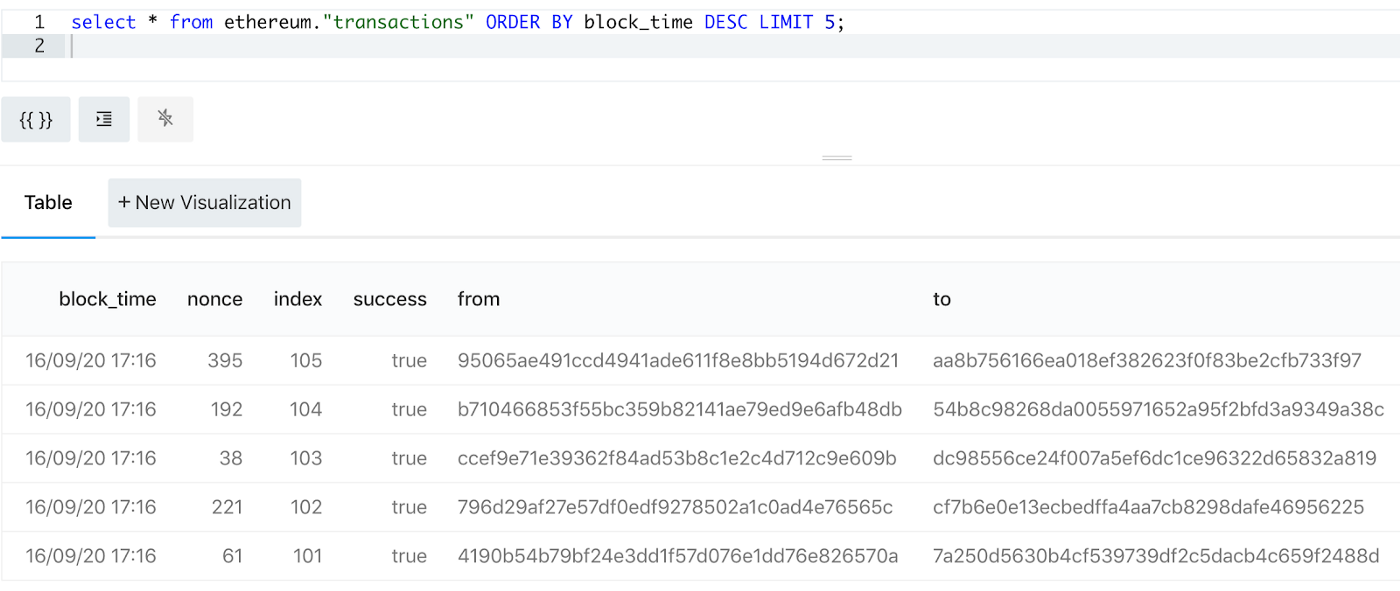
Example query of 5 Ethereum transactions (source)
All this information is available for free. The free tier (requires opening an account) covers:
- Searching queries
- Writing new queries
- Creating visualizations and dashboards
All free tier queries are available for everyone to see and search. Making queries private requires a pro tier account. The pro tier offers some additional benefits, such as exporting data and hiding the watermark from graphs.
Information from blocks is parsed and populated into the database of Dune with a few minutes of delay. Besides raw blocks and transactions, Dune also has information on asset prices, and specialized tables such as all the eligible addresses for the UNI token.
Now, let’s get familiar with how to use Dune without writing a single line of code, and later take a look at some SQL basics.
Starting with Dune Analytics
After opening an account, the home page will look something like this:
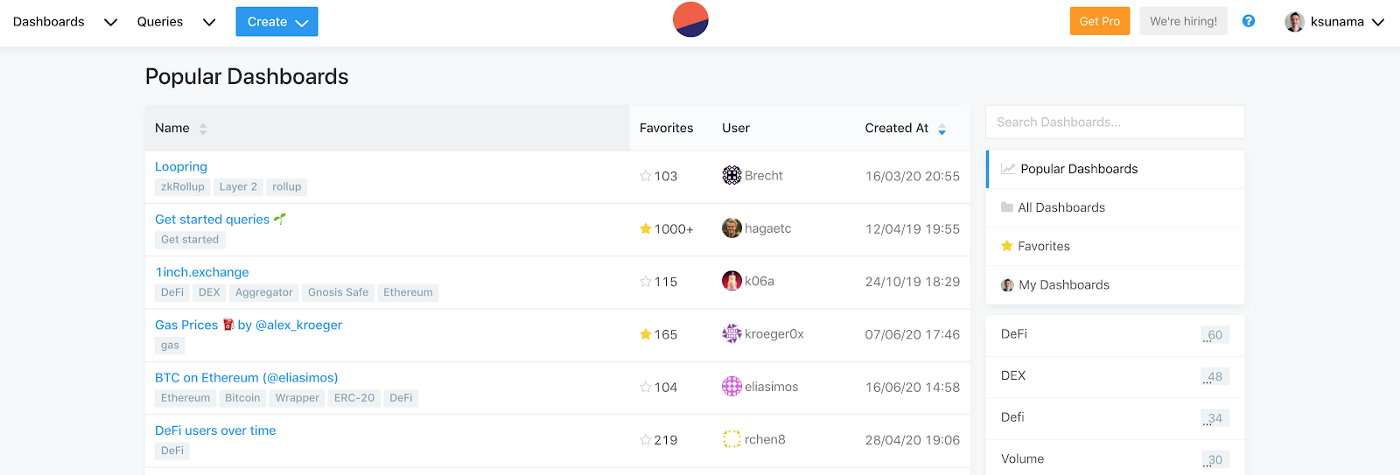
Dune Analytics app after sign in
The first screen you see is a list of popular dashboards. Dashboards are aggregations of queries and plotted graphs that other users have created, usually around specific topics.
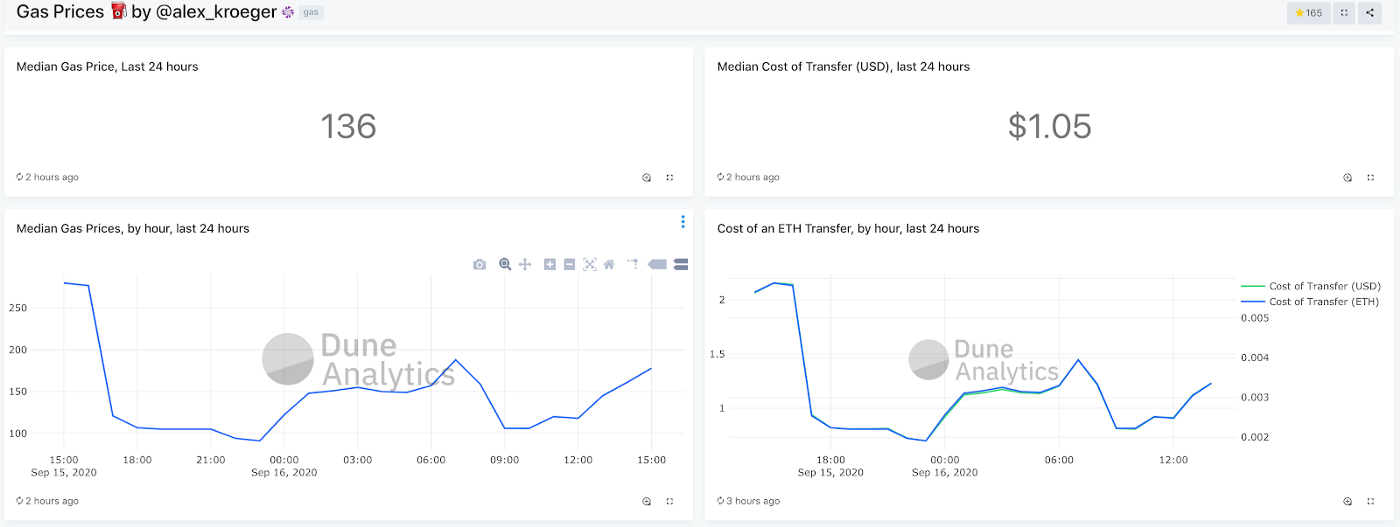
Ethereum Gas Prices Dashboard (source)
There are a plethora of dashboards to investigate, covering popular DeFi projects, DEX volumes, Ethereum transactions gas usage, and much much more.
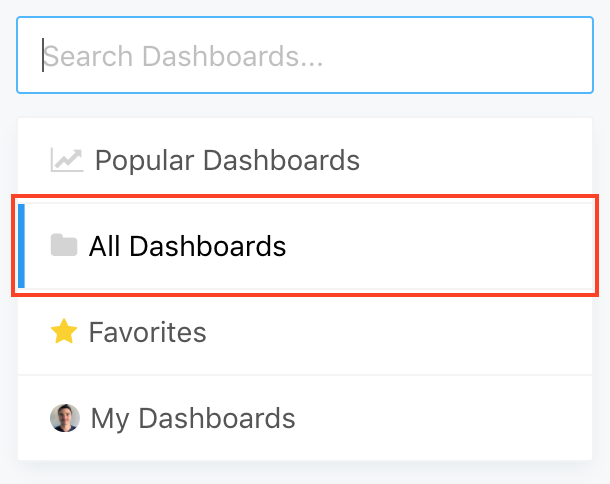
You can search for dashboards on a specific project in the search bar on the right. Be sure to select All Dashboards if you do not find a relevant dashboard in the popular dashboards section. The search only searches through the selected list.
Each dashboard is comprised of individual queries. Each plot can be selected, viewed, and edited.
Graphs can be easily manipulated from the dashboard view itself. Zooming in, selecting a part of the graphs, etc. Double-clicking the title of the graph selects the specific query creating the graphs.
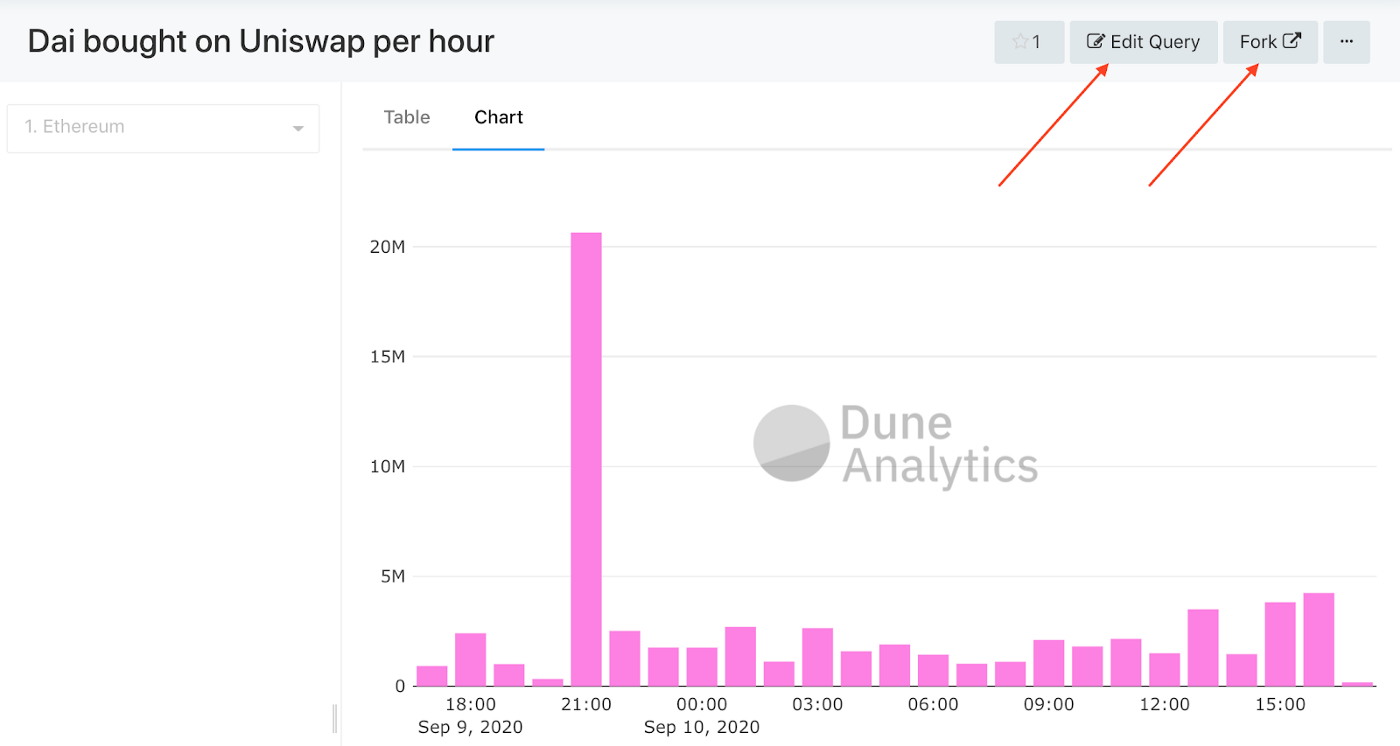
Example of a selected graph from a dashboard
Here you can either choose Edit Query to view the query or make minor manipulations, in place, or choose fork to copy the query to your own workspace, where you can make manipulations, save the changes, and create new graphs. We will cover editing and creating queries in the next sections.
Searching for queries
Just like searching for dashboards, you can select queries from the top bar to search through queries.

Not all queries are added to a dashboard, so there are many more queries to sift through. Successfully finding a query of interest of course depends on the author labeling and writing it correctly. Once you find a query of interest, you can select, edit, or fork it, just like any query in a dashboard.
Dashboards are usually a more curated subset of queries, which the authors chose to highlight. When looking for information on a specific project, it is better to start with the dashboards and move on to searching queries if you can’t find what you are looking for.
What if you just can’t find what you are looking for? Time to get your hands dirty with some SQL.
Writing queries
Dashboards and queries by other Dune users are a great place to start when looking for information on a specific project, but sometimes the queries in existence are not enough to answer whatever question you are researching.
Luckily, Dune works with a standard PostgreSQL query language. It is easy enough to use to make some basic queries, even if you have never written SQL before.
First, the most useful place to get started is dashboards and queries written by others. As mentioned, all public queries can be forked, or you can simply copy the code from others. This is great to either make slight alterations to a query that answers most of your needs or simply to learn a new capability and tricks from others. For this short tutorial, will write some basic queries for scratch, but it is always useful to look at related work for inspiration.

Create a blank query
To create a new query, select the option from the upper left corner. You’ll see the following screen
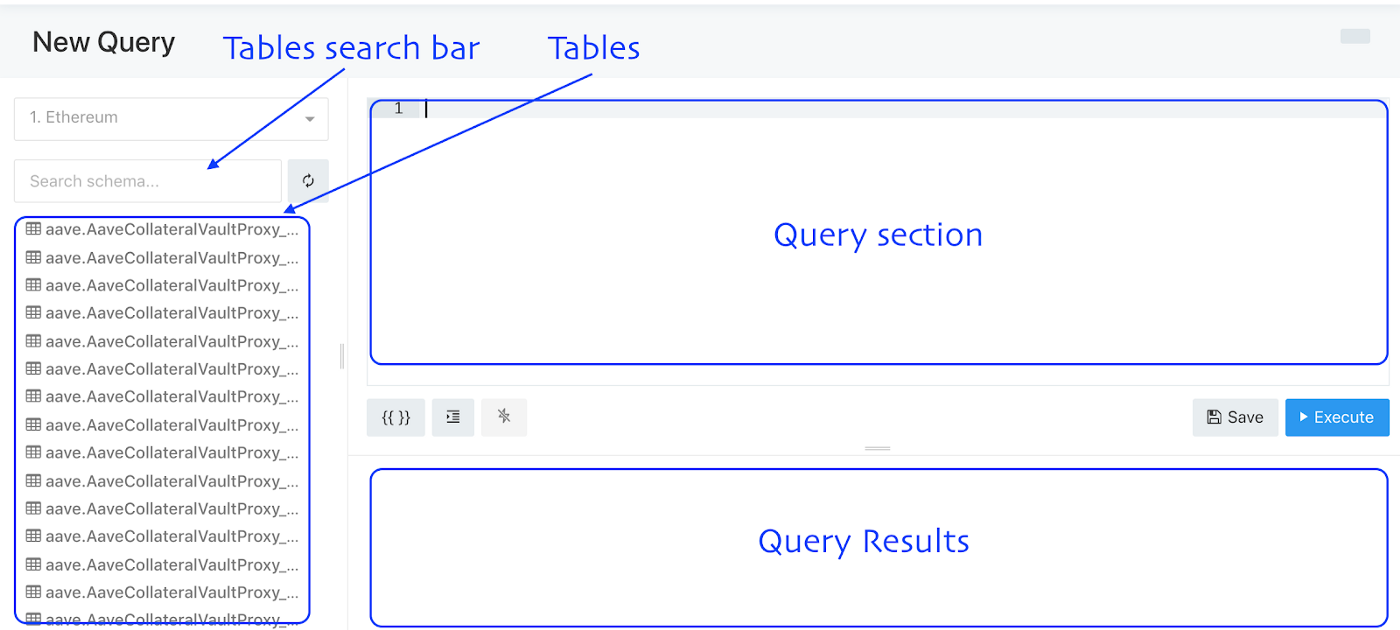
Section of a new query view
The tables list on the left contains all the existing SQL tables you can use to create your query. Many popular projects have specialized tables, with information parsed specifically for them. These can be very helpful when looking at a specific project. Although it is always possible to directly parse the data field of all transactions, however, this could be cumbersome and not always accurate.
Some examples of very useful tables are
- ethereum.transactions: All transactions on Ethereum
- ethereum.logs: Logs of Ethreum events emitted by contracts (such as Transfer)
- erc20.ERC20_evt_Transfer: All the transfer events emitted when sending tokens
- prices.layer1_usd : A price table for ETH and many other popular tokens, on a per-minute resolution
First query
Every query starts with a research question. The first step is to always clearly define what would we like to know. For a simple example, let’s look at the 5 most recent transactions.
Naturally, we would find the answer in a table that has all Ethereum transactions, so we start by searching for the table in the search field. In this case, searching for “transaction” will bring up the list of relevant tables, out of which we can chooseethereum.transactions.
Clicking on the table in the table list will show all the columns available in that table. In this case, we use the ethereum.transactions table and its columns are, hash, index, gas_price etc.
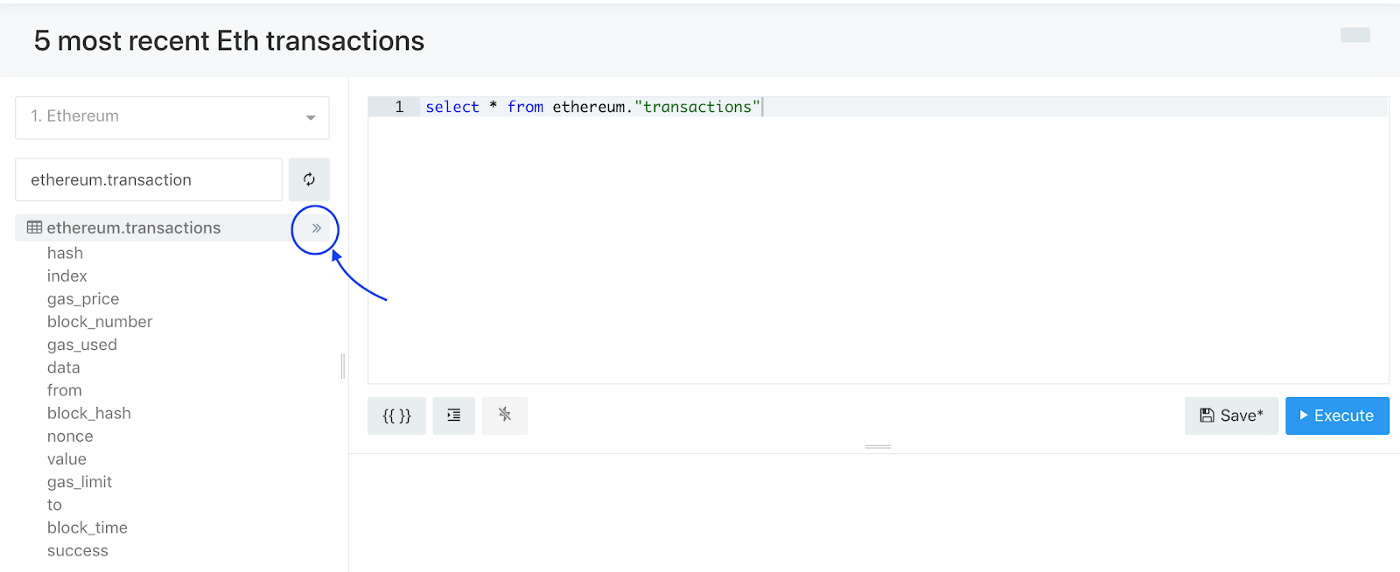
Click the double arrow to copy the name into the query field
Clicking the double arrows next to the tables or column names will paste the name in the query section. This helps to avoid manual copy-pasting and typos.
In this simple example, we select “*”, meaning selecting all columns, from the table ethereum.transactions.
Before running this query, it is important to note that some queries can take a very long time to complete, and return too much data. Especially when starting to work on a query, it is useful to limit the number of returned entries to speed up the process. This can be done by adding the “limit” clause. This limits the number of returned rows to the specified number.
select * from ethereum.”transactions” limit 5
Once the query is written, press execute (or control + enter) to run it.
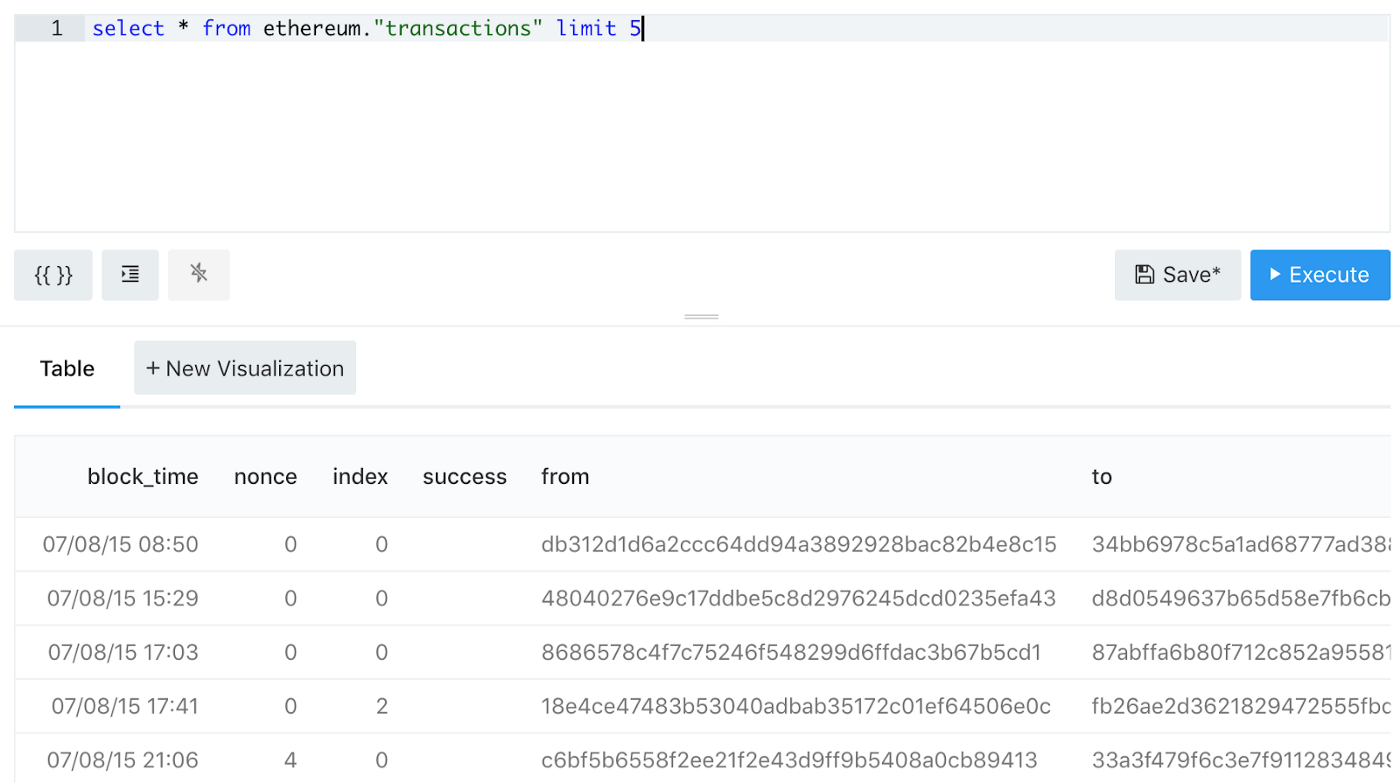
The results of running a simple query are displayed in the results section
Great, we have some results in the results section, but these are the first-ever Ethereum transactions. To get the last ones, we can first sort the query by a descending order in one of the columns. In this case, the block time or block number can be a good choice
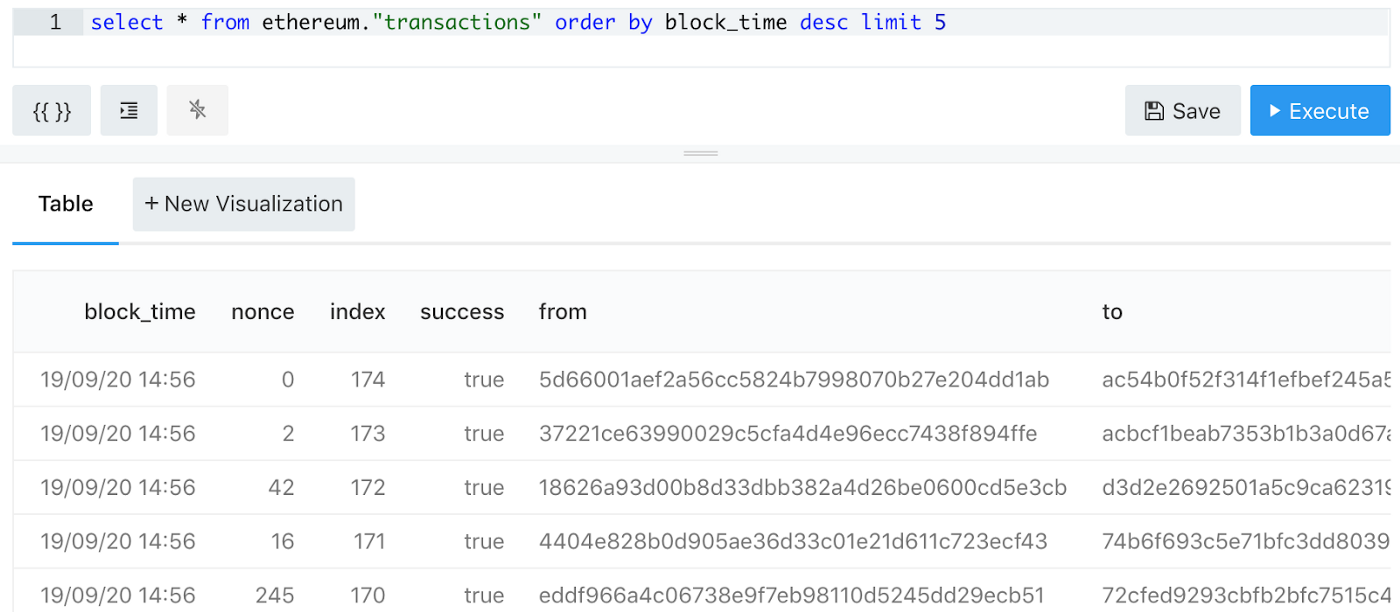
Sorted results from Ethereum transactions
Now we have 5 transactions from the latest block. Tables are not showing live data, there is some delay between when a block is created and added to the tables.
As with every work, saving a query occasionally is very much recommended, especially when making a complicated one (Ctrl+S / Cmd+S works).
This simple query can be found here.
Visualizing the data
In addition to simply storing the data, Dune Analytics has a powerful way to visualize it. For this example, let’s look at a slightly more complicated query. We’d like to know the total value of ETH sent per day, in the past 10 days. This will also help to demonstrate filtering, and grouping data by time.
The query to get this data is the following
Let’s break it down
- date_trunc(‘day’, block_time): We do not need to select all the columns in the table, but only the ones we need. In this case, the block time and the value of ETH sent. block_time is in Unix timestamp format, but we are only interested in getting the “day” portion of it, so we truncate the rest of the data
- as “Date”: Gives the column an alias. This is not necessary but makes results easier to read, and graphs automatically have better labels.
- sum(value/1e18): Since we are summarizing all the ETH sent, we use the SUM function to aggregate the data. Since ETH has 18 decimals of precision, we divide the number by 1e18, got get values in ETH and not in Wei
- where block_time > now() — interval ’10 days’: Only look at block times of the past 10 days. This will also make the query run much faster
- group by 1 order by 1: 1 here is the first column we chose (date_trunc). We group the results by date and order them by date. Since we are grouping data per day, we must use an aggregating function for all other columns we select. In this case, we use SUM but we could have also used MAX, MIN, AVG, or any other aggerating function, depending on our needs.

Executing the query will result in something like this. A list of dates and the sum of ETH transferred during these days.
Now we would like to plot this data. Select the New Visualization to go to the visualization menu.
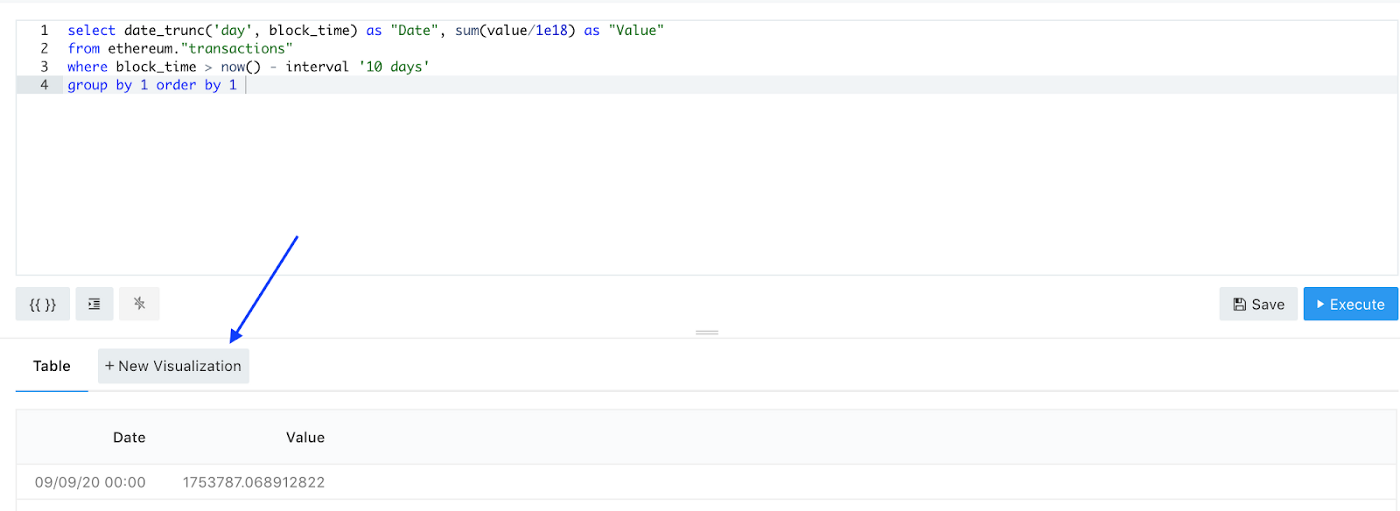
New visualization button
This will open up the following menu
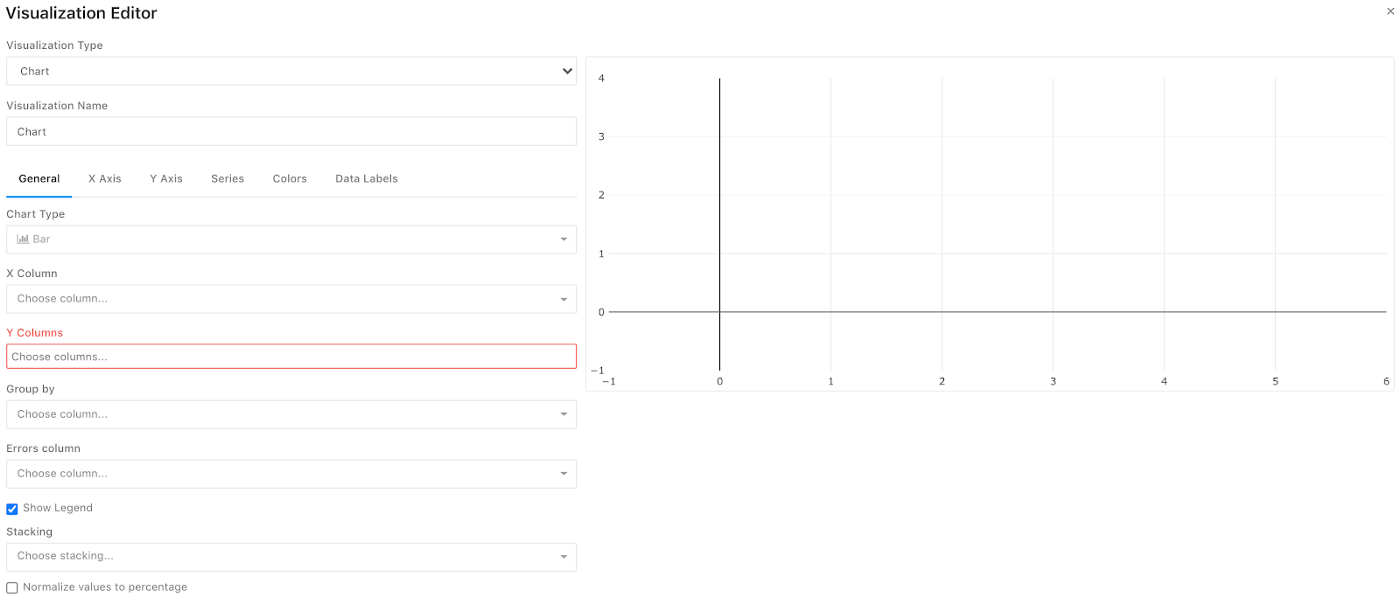
Dune Analytics visualization menu
There are several visualization types to choose from. The most useful is probably the chart to plot a simple graph, but there are also Counter for displaying a single piece of data, pivot tables, and more.
In this case, we want a chart. We want to plot the sum of sent ETH as a function of the date. Select the X and Y axis accordingly
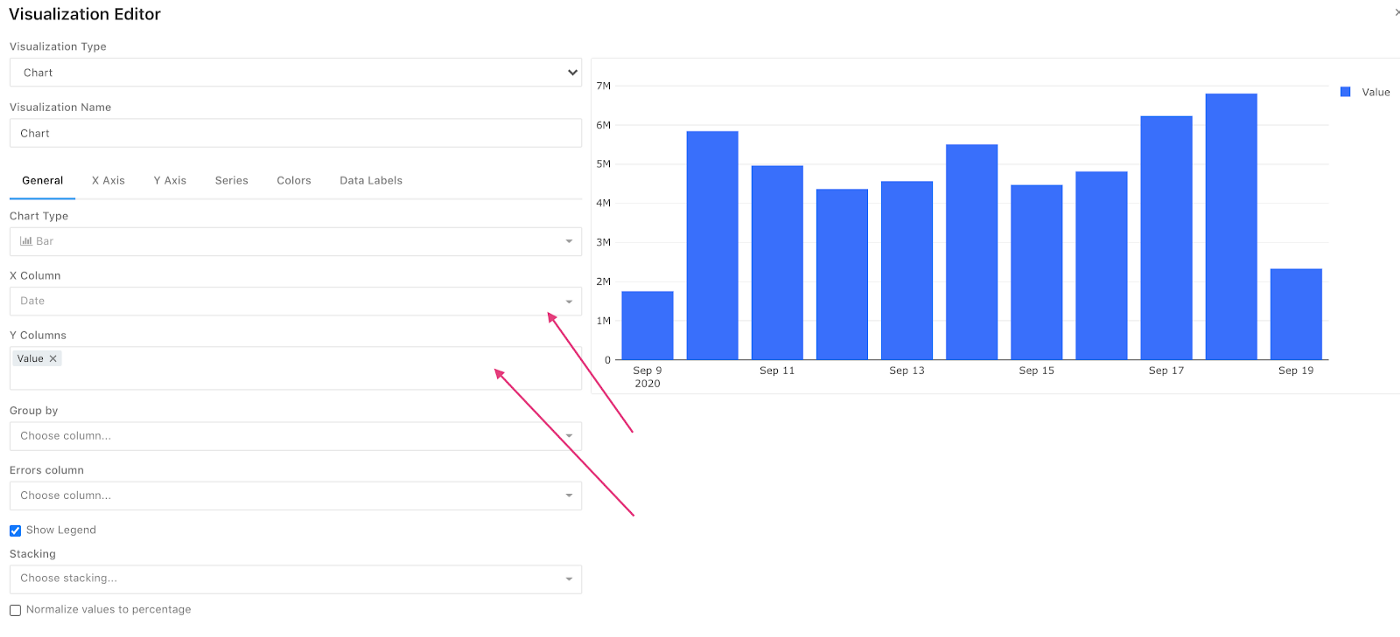
That’s it, we have a basic graph. There are many more possibilities to play with. The graph style, colors, labels, and more.
Finally, save the graph to add to the query results. More than one visualization can be created for each query.
This example is available here.
Slightly more advanced queries
Up until now, we have only looked at queries from a single table. A single table might not have all the information we need. To demonstrate this, let’s take the previous example, but instead of showing the amount of ETH sent, we’ll plot the amount of USD value transferred in ETH.
The ethereum.transactions table does not have any price data. Fortunately, Dune does provide price data, per minute, for a plethora of assets.
To create our table we need to JOIN data from the transactions table and the prices table
Let’s break it down line by line:
First, we create a new auxiliary table, with all the data we need. We need this new table so we can more easily aggregate and sum the data later.
- with txs as: Create a new table called txs from the following data
- from ethereum.”transactions” e: Take data from the table ethereum.transactions, and alias it the table as “e”
- join prices.”layer1_usd” p: Join the table with the table for prices and alias it as p. This join operation will result in a table with a column from both tables combined
- on p.minute = date_trunc(‘minute’, e.block_time): A join operation requires you to specify which column you want to join on. In this case, prices are only registered every minute, so we want to join the data with the minute the block was created. This will result in an entry for each transaction, but with the additional data from the prices table
- where block_time > now() — interval ’10 days’: As before, only take data of the past 10 days
- and symbol = ‘ETH’: The prices table has prices for many tokens, we are only interested in the price of ETH
- select date_trunc(‘day’, ... as “Value” from txs: Finally, we run the same query as before, but we multiply the value in ETH by the price. We also take the data from our txs table.
Finally, plotting the data will result in the following graph
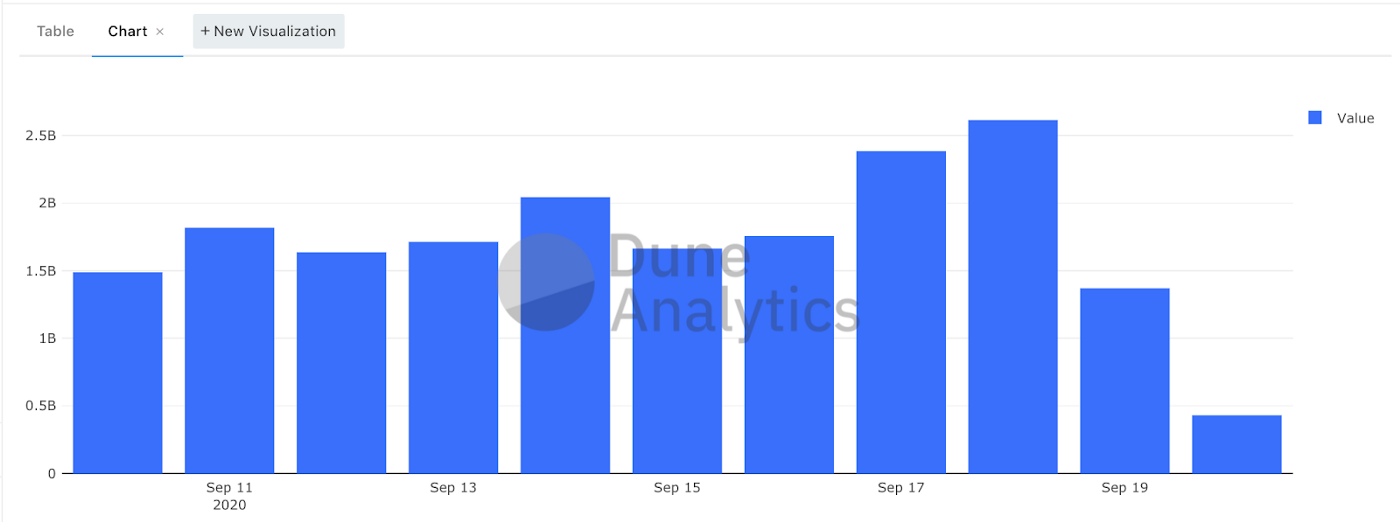
The code for the query is available here
Creating a dashboard
Now that we have to graphs, we can aggregate them into a dashboard. Click “Create” -> “New Dashboard” and give your dashboard an informative name

Widgets can be added with the “Add Widget” button in the dashboard panel, or with the “Add to Dashboard” button in each visualization in each query.

Example of a simple dashboard
The dashboard is available here
Looking at addresses
Finally, to demonstrate how to look for events associated with specific addresses, we’ll modify the query slightly to see the amounts of ETH transferred by addresses associated with the co-creator of Ethereum, Vitalik Buterin.
This is almost the same query as before, except now we add a filter on the “from” column. Notice the format of the address. It must start with \x instead of 0x as you would most likely find it in a block explorer. This is a very common error when working with addresses in Dune, so this is important to point out. The query and its results are available here.
What’s next?
The purpose of this tutorial is to get acquainted with the basic functionalities in Dune and to try out some basic examples. This is not an extensive guide on PostgreSQL, resources for which are abundant (Udemy, Codecademy, Youtube, Stack Overflow++), but hopefully, introduces some basic commands to get you started with.
There is of course lots more to explore and uncover, including plentiful prefilled tables for various DeFi projects, adding your own tables via pull requests, and more.
Dune Analytics is a super powerful tool in a blockchain research arsenal. Being able to query vast amounts of data in and simply and quickly truly feels like a superpower.
More resources
Examples of Useful Tables
- ethereum.transactions: All transactions on Ethereum
- ethereum.logs: Logs of Ethreum events emitted by contracts (such as Transfer)
- erc20.ERC20_evt_Transfer: All the transfer events emitted when sending tokens
- prices.usd: A price table for WETH and many other popular tokens, on a per-minute resolution
- dex.trades: All DEX trades
Other links
- Popular Dune dashboards
- Dune Analytics docs
Thanks to Alex Manuskin for writing this post! You can find him here:
Dune: @ksunama
Twitter: @amanusk_
Github: @amanusk
Original Medium post here.
---
Header photo by Danielle MacInnes on Unsplash
Ready to bring your Blockchain to Dune?

Interested to join Dune?
Ready to bring your chain to Dune?
Ready to get started?
Individuals + Small Teams

Enterprise


.png)